The Flag of Data (2017)
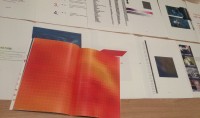
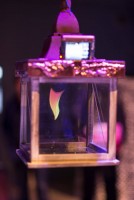
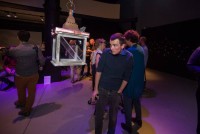
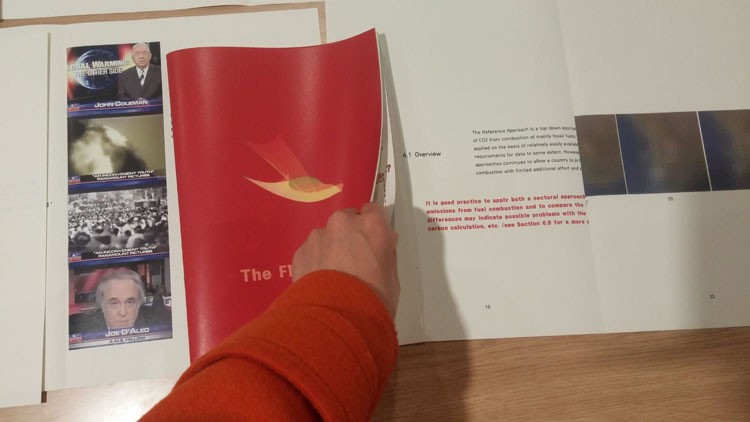
The Flag of Data (2017) is an installation that plays on the ambiguity of data. The visualized movement of a flag changes according to the ambiguity and differences between data-sets. The comparison made in the installation is that of the differences between data sets of CO2-emissions (per country) made by different agencies. The Flag of Data makes the inexactness of these datasets visible. The installation is presented together with a video that shows news about the inaccuracies. The piece asks you to rethink the accuracy of data in a time where it is easily manipulated and there is an irrational belief that science can solve all our problems. It is a call to a more sensible understanding of the use of data.
The flag of data는 데이터의 모호함이라는 주제와 함께 제작된 작품입니다. 이 작업에서 각기 다른 기관이나 연구소에서 만든 2006년 이산화 탄소 배출량의 데이터세트들을 국가별로 비교하고 그것들 사이에서 나타나는 차이점에 따라 깃발의 움직임 달라지는 작업 입니다. 같은 나라 같은 년도의 이산화탄소임에도 불구하고 나타난 차이점은 데이터의 모호함, 부 정확성을 의미합니다. 램프의 지붕에 설치되어 있는 모니터는 데이터의 부정확한 것에 대한 뉴스, 기사를 보여줍니다. 이 작품을 통해 데이터의 정확성에 대해 재고할 것을 요청합니다. 또한 과학은 모든 문제를 해결할 수 있다는 비합리적인 믿음과 함께 데이터 사용에 대한 보다 현명한 이해를 요구합니다.
size: 26x45x26(cm)
marterial: Raspberry pi, 3Dprinting, LCD monitor, transparent glass, lamp, datasets, java
PDF file link :
https://drive.google.com/file/d/1JHdmyyxDzKAA0g2tnk3JfDlsUvGeOcG_/view